
The Electrification Threshold: How COP31’s 35-by-35 Target and CBAM’s First Certificate Year Reset Industrial Heat Pump Payback
The world has agreed on a number for electrification. Every factory has a different one, and it is set by the price of the fuel it is trying to stop burning.
Key takeaways
- COP31 in Antalya launched a 35-by-35 global electrification commitment on 10 November — electricity from about 23% of final energy today to 35% by 2035 — with the IEA named to run the tracking mechanism and Climate Action Tracker estimating current policies reach only 28%.
- The number that actually decides a project is the break-even electricity price: COP × fuel price ÷ boiler efficiency. At COP 3.2 that is US$0.256/kWh against LPG, US$0.077 against US$6 gas and only US$0.059 against coal — a 4.3x spread in the same region.
- Against a coal baseline, an industrial heat pump would need a COP of 4.4 in Vietnam and above 6 in South Africa. That is not a technology gap; it is a market boundary, and it moves the addressable fleet from coal to LPG, diesel and purchased steam.
- CBAM’s first certificate year has a price — EUR 82.32/t for Q3 2026 — plus hard dates: certificate sales open 1 February 2027, first annual declaration due 30 September 2027, and default-value mark-ups rising 10% → 20% → 30% from 2026 to 2028.
- Indonesia signed its first Article 6.2 purchase agreement with Norway on 11 November, capped at 12 MtCO2e to 2038 at an estimated US$20–40/t — which is worth only about US$1.65 per MWh of grid-powered heat abated, and roughly US$8 per MWh when the power is green.
For three years the industrial heat pump conversation in Southeast Asia and Africa has been conducted in equipment language: coefficient of performance, refrigerant, footprint, lead time. This week the conversation moved up a level. At COP31 in Antalya, the Turkish presidency put a number on the whole transition — 35% of final energy from electricity by 2035 — and named the IEA to keep score. It is the first time a global climate summit has adopted electrification itself, rather than a fuel or a technology, as the organising goal.
That is strategically important for anyone selling pompes à chaleur haute température, because industrial heat is the largest remaining block of un-electrified energy in the world, and the least discussed. But a global percentage does not pay back a single machine. Every plant has its own threshold, and the threshold is not a policy variable — it is arithmetic. It is the price at which a kilowatt-hour of electricity becomes cheaper than the fuel the boiler is burning today.
This week’s five developments matter because each one moves a term in that calculation: one raises the political priority, two put a price on the carbon embedded in the heat, one makes abatement contractible at a known price, and one shows what happens when a carbon market exists on paper but does not trade. Read together, they suggest the constraint on process heat electrification is no longer whether the machine works. It is whether the numbers on either side of the meter line up.
Five signals from COP31 week, 9–16 November 2026
1. COP31 adopts electrification as a goal, and gives it a percentage
On 10 November, the Energy and Transport Day at Antalya, the COP31 presidency formally launched the Global Electrification Commitment — universally shortened to 35 by 35. The target: lift electricity’s share of global final energy consumption from roughly 20–23% today to 35% by 2035, by electrifying transport, buildings and industry. The presidency describes it as opening “the electric age”, and frames it explicitly as an energy-security argument as much as a climate one: this year’s oil and gas price shocks, and the disruption to Hormuz shipping, have made import dependence a live industrial risk.
The mechanics are worth noting precisely, because they tell you how much weight to put on it. Australia, Ethiopia, Germany and Norway had endorsed the commitment at launch; the European Union co-hosted the first Electrification Forum on the same day, convening governments, institutions, companies and financiers; and the IEA will lead the global tracking mechanism for electrification trends at global and regional level. Climate Action Tracker’s assessment is that current policies deliver only about 28% by 2035 — a seven-point gap that has to be closed by policy, not by equipment catalogues.
Why it matters. A voluntary commitment is not a subsidy, and it will not appear on a quotation. What it does is change the direction of travel in every ministry that has to allocate grid capacity and concessional finance over the next decade. For an industrial heat pump supplier, the practical read is that industrial heat electrification has moved from “a niche efficiency measure” to “a line item in a national electrification plan” — which is the category in which projects get grid connections approved.
2. Kenya and Nigeria sign the rooftop solar declaration — and expose the real African constraint
Also on 10 November, a group of governments endorsed a voluntary Global Rooftop Solar Declaration, aiming to double the number of households with rooftop solar from about 150 million to 300 million by 2030. The initial endorsers included Kenya and Nigeria alongside Australia, Bangladesh, Palau and Vanuatu, with Indonesia’s state utility PLN among the supporting institutions, and 34 legislators from 21 countries backing it. The declaration focuses on permitting simplification, affordable finance, distribution-grid modernisation, fair access and skills — and explicitly calls for paired battery storage.
The context is the number that should sit next to every African industrial energy conversation: roughly 600 million Africans still lack access to electricity, and emerging markets and developing economies outside China hold close to two-thirds of the world’s population but received only 18% of global clean energy investment in 2025.
Why it matters. The declaration is about households, not factories, and it is non-binding. But it points at the binding constraint for industrial heat pump deployment in Africa, and it is not the price of the machine. It is the availability and reliability of the electron. In Nigeria, as the next section shows, the economics of replacing a diesel boiler are almost absurdly favourable — and projects still stall, because a heat pump is a continuous-duty machine and the grid is not. That is why the winning African configuration is increasingly a heat pump paired with captive solar and storage, or sited inside an industrial park with a dedicated supply, rather than a grid-connected retrofit.
3. CBAM’s first certificate year has a price, and a paperwork deadline
CBAM moved into its definitive phase on 1 January 2026, and the operational detail has now firmed up into something a plant can budget against. The reference certificate price for Q3 2026 was published on 5 October at EUR 82.32 per tonne of CO2, after EUR 75.36 in Q1 and EUR 75.28 in Q2. Certificate sales open on 1 February 2027, covering emissions in goods imported during 2026. The first annual declaration, with surrender of certificates, is due by 30 September 2027. From 2027 the price reference shifts from a quarterly to a weekly EU ETS average, and importers must hold at least 50% of embedded emissions each quarter.
Two design features carry most of the commercial risk. First, the free-allocation factor falls from 97.5% in 2026 to 51.5% in 2030, so the same emissions intensity produces roughly double the certificate bill by the end of the decade. Second, where verified actual data is missing, the EU applies default values with a mark-up of 10% in 2026, 20% in 2027 and 30% from 2028 — a penalty designed to be large enough that nobody wants to pay it.
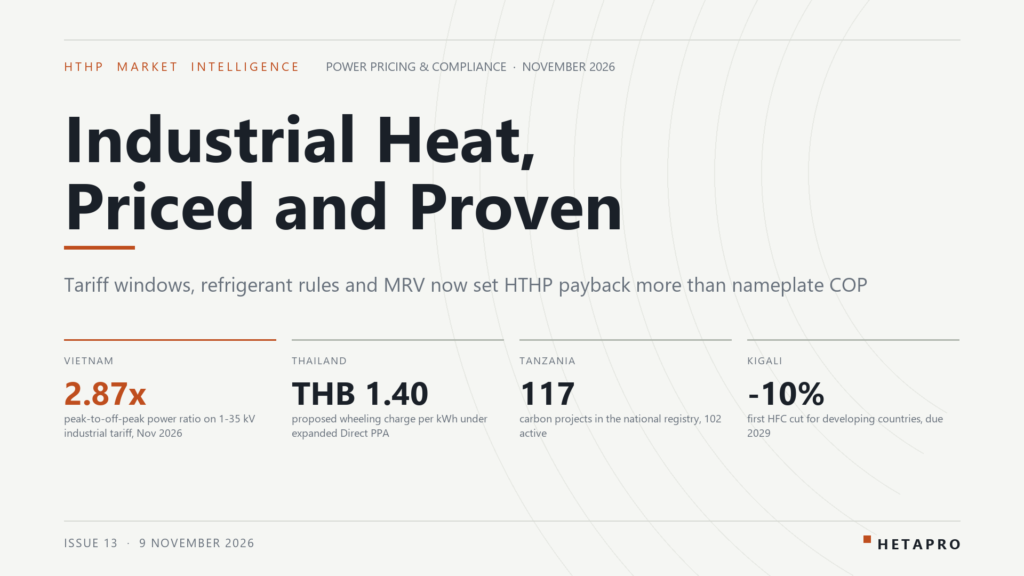
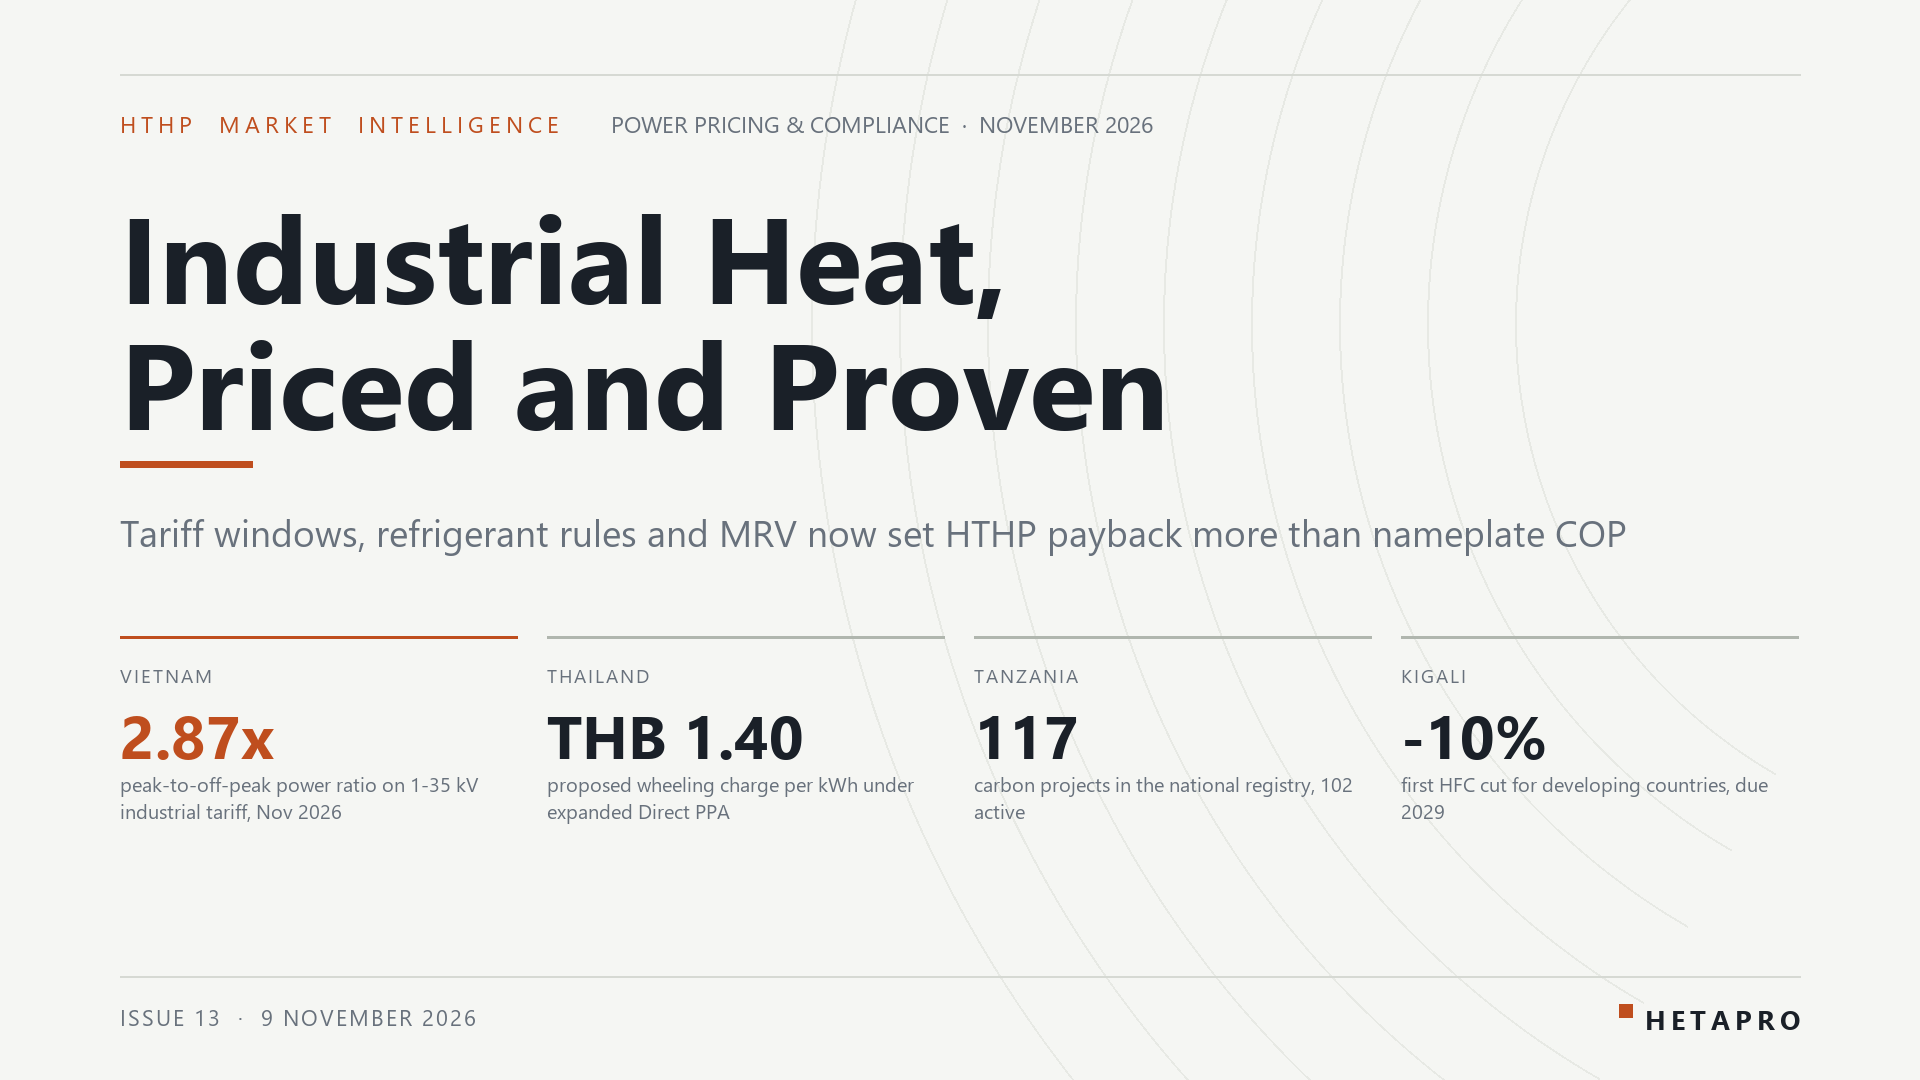
The regional evidence is now quantitative rather than rhetorical. Malaysia’s government, in a parliamentary reply citing the Malaysian Steel Institute, costed 2026 CBAM exposure for iron and steel at about MYR 970.7 million (US$237 million) — the first official national costing published by any ASEAN government. Indonesia’s National Economic Council reported in late October that a single-case simulation showed verified national data could cut compliance cost by around 90% compared with EU default values, and warned that default-based calculations could push the carbon cost of some products above their selling price. Indonesia’s CBAM-covered exports to the EU are around US$2.32 billion, about 11.9% of its exports to the bloc.
Why it matters. Process heat sits inside the installation boundary of every CBAM-covered good, and fuel burned for steam is the easiest line in the emissions inventory to measure and the easiest to reduce. A plant that electrifies its steam load and can document the change has converted a cost into a verified number — which, under the 30% mark-up regime, is worth more than the energy saving in some product categories. Conversely, a plant that cannot document its fuel and power data will be charged the default, and the default assumes the worst.
4. Indonesia signs its first Article 6.2 purchase agreement — abatement now has a contract price
On 11 November, at the Indonesia Pavilion in Antalya, Indonesia and Norway signed the country’s first Mitigation Outcome Purchase Agreement under Article 6.2 of the Paris Agreement, following an intent recorded at COP30 in Belém. The agreement was signed by state utility PLN and the Global Green Growth Institute, with Norway’s Article 6 climate action fund providing support through GGGI’s Carbon Transaction Facility. PLN may transfer emission reductions from floating solar plants to Norway up to a ceiling of 12 million tonnes of CO2e by 2038, with each claimed reduction estimated at US$20–40 per tonne.
Read the fine print before treating this as a carbon price. The US$20–40 is an estimate, not a fixed contract price; the 12 Mt is a ceiling, not a commitment; and the claim that this is the largest Article 6.2 transaction to date is the Indonesian environment ministry’s characterisation rather than an UNFCCC assessment. What is genuinely new is the structure: government-to-government mitigation purchase moving from a bilateral memorandum into a contract with a quantity and a price band.
Why it matters. For an industrial heat recovery project, this is the first credible answer to the question “what will my credit actually sell for?” The answer, in this deal, is a band centred well below the CBAM certificate price. That gap — roughly US$30 a tonne for a voluntary or Article 6 credit against EUR 82 for a CBAM certificate — is the single most useful number in this week’s news, because it tells you which of the two carbon instruments to design a project around.
5. The Philippines builds an energy-sector credit framework; Vietnam’s market barely trades
On 9 November, speaking at the Philippines Net Zero conference, Energy Secretary Sharon Garin said the Department of Energy’s carbon credit framework for the energy sector is close to completion and will be finalised within the year, deliberately sequenced ahead of a broader national framework so that the country can open Article 6 conversations with Singapore and Japan. It sits under Executive Order No. 127, which established the national carbon market policy framework.
Vietnam offers the counter-example. Its pilot carbon exchange has been running on the Hanoi Stock Exchange since 29 June 2026, trading VN2025 allowances for the 2025–2026 compliance period. Registered allowances exceed 510 million tonnes, et 92 enterprises are enrolled — concentrated in steel, cement and thermal power. But cumulative trading volume is around 1,200 tonnes of CO2e, with turnover of roughly VND 161 million. Under Decree 29/2026, participants bear no fees during the pilot; credits may offset up to 30% of allocated allowances; trading runs to 24 December 2027, with a full market planned for 2029.
Why it matters. A carbon price that does not trade is not a revenue line. Vietnam has built the registry, the legal basis and the participant list, but not yet the price discovery — which means a heat pump payback model that assumes domestic carbon revenue in Vietnam between now and 2028 is assuming something the market has not delivered. The Philippines’ sector-first sequencing is the more practical template for an industrial project: get the measurement and the bilateral channel right in one sector before widening.
| Instrument | Key number | What it changes | Which term it moves | Action for an HTHP project |
|---|---|---|---|---|
| COP31 35-by-35 commitment (global, 10 Nov) | 35% of final energy by 2035, from ≈23% | Political priority for grid capacity and concessional finance | Probability of getting a connection and cheap capital | Position industrial heat inside a national electrification plan, not an efficiency programme |
| Rooftop solar declaration (Kenya, Nigeria + 4, 10 Nov) | 150m → 300m households by 2030 | Distribution grid and generation adequacy | Whether the electron exists at the hour you need it | Design for captive solar plus storage where grid reliability is the constraint |
| CBAM certificate year (EU, from 1 Jan 2026) | EUR 82.32/t (Q3 2026); factor 97.5% → 51.5% by 2030 | Cost of CO2 embedded in exported goods, including process heat | Adds a revenue-equivalent to every tonne avoided | Meter fuel and power per functional unit; verified data beats the 30% default mark-up |
| Indonesia–Norway MOPA (Article 6.2, 11 Nov) | 12 MtCO2e ceiling to 2038; ≈US$20–40/t | Contractible price for sovereign abatement | Sets the realistic value of a carbon credit | Do not underwrite a project on credit revenue at these prices |
| Philippines DOE credit framework (9 Nov) / Vietnam ETS pilot | Finalised within 2026; VN pilot traded ≈1,200 t | Domestic pathway versus domestic illiquidity | Timing of any credit cash flow | Treat domestic carbon revenue as 2029+ in Vietnam; watch the Philippines energy channel |
The one ratio that decides every project
Strip away the policy and a heat pump competes with a boiler on a single comparison: the cost of a delivered kilowatt-hour of heat. The boiler’s cost is fuel price divided by efficiency. The heat pump’s cost is electricity price divided by coefficient of performance. Set them equal and you get the number that should appear at the top of every proposal.
Definitions used precisely
Industrial heat pump (IHP): an electrically driven machine that recovers low-grade heat from process water, exhaust air, flue gas or wastewater and upgrades it to usable process heat. A category, not a temperature rating.
High-temperature heat pump (HTHP): the subset supplying above roughly 100 °C. Proven platforms reach 120–200 °C, or saturated steam to about 16 bar; COP is typically 2.5–3.8 in the 100–165 °C band and is governed by temperature lift, not by the datasheet headline.
Electrification threshold: the electricity price at which an industrial heat pump delivers heat at the same cost as the incumbent boiler. Equal to COP × fuel price per kWh ÷ boiler efficiency. Above it, electrification pays; below it, it does not, whatever the carbon story says.
Required COP: the same equation solved the other way round — the coefficient of performance a machine would need to break even at today’s tariff and fuel price. If the answer exceeds what the technology can physically deliver at the required temperature, the segment is closed.
Required COP = (electricity price × boiler efficiency) / fuel price per kWh
Worked: LPG at US$0.90/kg, 46.1 MJ/kg, 88% boiler, COP 3.2
Fuel cost per kWh = 0.90 / 12.81 = US$0.0703/kWh
Cost per kWhth in the boiler = 0.0703 / 0.88 = US$0.0799/kWhth
Break-even power price = 3.2 × 0.0703 / 0.88 = US$0.256/kWhe
That result is the most under-used number in the industry. It says that at COP 3.2 an industrial heat pump can pay for itself against LPG even where electricity costs 3.6 times what the LPG costs per kilowatt-hour of fuel. Most sales conversations never make this comparison, because most sales conversations start from the electricity bill rather than from the boiler’s fuel bill.
| Incumbent fuel | Assumed price | Boiler eff. | Heat cost now (US$/kWhth) | Threshold at COP 2.8 | at COP 3.2 | at COP 3.8 |
|---|---|---|---|---|---|---|
| Thermal coal | US$95/t | 80% | 0.0186 | 0.052 | 0.059 | 0.071 |
| Natural gas | US$6/MMBtu | 85% | 0.0241 | 0.067 | 0.077 | 0.092 |
| Natural gas | US$10/MMBtu | 85% | 0.0401 | 0.112 | 0.128 | 0.153 |
| LPG | US$0.90/kg | 88% | 0.0799 | 0.224 | 0.256 | 0.304 |
| Diesel | US$0.95/L | 85% | 0.1122 | 0.314 | 0.359 | 0.426 |
The spread is the story. Between coal and diesel the threshold moves by a factor of 6.1. Two factories in the same industrial estate, on the same electricity tariff, with the same steam demand, can therefore face completely different answers — and the difference is entirely in what they are burning. This is why heat pump payback claims that travel across markets are almost always wrong, and why the first question in any qualification call should be about fuel, not about temperature.
Country by country: where the ratio clears, and where it cannot
Putting real 2026 tariffs against typical incumbent fuels produces a map that is more useful than any market-size forecast. The right-hand column asks the only question that matters commercially: how much headroom does the threshold offer against the electricity price the plant actually pays?
| Market | Industrial tariff (US$/kWh) | Typical incumbent fuel | Threshold at COP 3.2 | Headroom | Verdict |
|---|---|---|---|---|---|
| Vietnam | 0.082 (blended, 1–35 kV) | LPG boiler | 0.256 | 3.1x | Wide open for food, textile and beverage steam; payback typically 1.7–2.4 years |
| Vietnam | 0.082 | Coal boiler | 0.059 | 0.7x | Closed — required COP ≈ 4.4, above commercial HTHP capability at 165 °C |
| Thailand | 0.12 | Piped gas, ≈US$9/MMBtu | 0.116 | 0.96x | Marginal — required COP ≈ 3.3; only viable with strong waste-heat recovery |
| Indonesia | 0.070 | Gas at US$6/MMBtu | 0.077 | 0.91x | Subsidised gas is the barrier; at US$8/MMBtu the threshold rises to 0.103 and the case clears 1.5x |
| Philippines | 0.16 | LPG at ≈US$1.05/kg | 0.298 | 1.9x | Open; the highest industrial power prices in ASEAN are an advantage here |
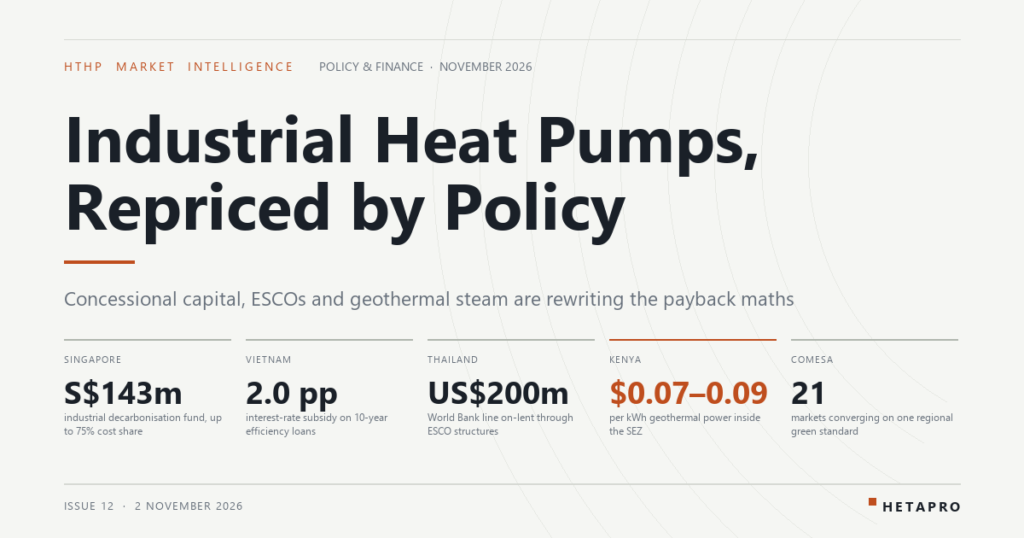
| Kenya | 0.15 | LPG at ≈US$1.10/kg | 0.312 | 2.1x | Open, and reinforced by geothermal power at US$0.07–0.09/kWh inside the Olkaria SEZ |
| Nigeria | 0.13 | Diesel at ≈US$0.95/L | 0.359 | 2.8x | Economics are overwhelming; the constraint is electron availability, not price |
| South Africa | 0.12 | Domestic coal, ≈US$70/t | 0.053 | 0.4x | Closed on price and weak on carbon — required COP ≈ 6.5; wheeled renewables change the carbon case, not the fuel case |
Two conclusions follow, and both are commercially uncomfortable for a supplier whose catalogue is temperature-led rather than fuel-led.
First, the addressable market is the liquid-fuel and purchased-steam fleet, not the coal fleet. Coal at US$95 a tonne delivers heat at under two cents a kilowatt-hour. No heat pump reaches the COP that would be required to match it — 4.4 in Vietnam, above 6 in South Africa. Every proposal that targets a coal-fired boiler on economics alone will fail, and the failure will be blamed on the machine rather than on the arithmetic. The segments that clear are food and beverage, textiles and dyeing, palm oil, paper, pharmaceuticals, automotive paint shops and any plant buying processed steam at a tariff — all of which burn LPG, diesel, heavy fuel oil, or buy steam from a gas-fired park.
Second, subsidised gas is a bigger barrier than expensive electricity. Indonesia is the clearest case. At US$6/MMBtu industrial gas, the threshold sits at US$0.077 against an industrial tariff of about US$0.070 — a 9% shortfall, which is exactly the kind of near-miss that destroys a business case. At US$8/MMBtu the same project clears with 47% headroom. Nothing about the heat pump changed. A single line in a gas pricing regulation did. This is why the most valuable intelligence a supplier can hold in Southeast Asia is not a COP curve but a gas price schedule.
Africa: where the threshold clears and the electron does not arrive
Nigeria deserves its own paragraph, because it inverts the usual objection. Diesel at roughly US$0.95 a litre delivers heat at about eleven cents a kilowatt-hour, and industrial power at roughly US$0.13 means a heat pump needs a COP of only about 1.2 to break even. No machine sold into an industrial application has a COP that low. The economics are not marginal; they are overwhelming.
And yet the market does not convert at the rate the arithmetic implies, for a reason that has nothing to do with thermodynamics. A high-temperature heat pump is a continuous-duty machine. It needs a supply that is present at every hour of a three-shift operation, at a stable voltage, without the deep frequency excursions that destroy compressor drives. In much of West and East Africa that supply does not exist at industrial scale, which is why so much process heat is raised by captive diesel or gas gensets in the first place.
The response visible in the market is architectural rather than commercial: pair the heat pump with captive solar, storage and a grid interface, and size the thermal store to ride through the outages rather than to arbitrage a tariff. That configuration is more capital-intensive, and it changes the payback calculation — but it converts an unreliable grid into a manageable input, and it is why Kenya’s Olkaria model, where tenants buy geothermal power at US$0.07–0.09/kWh alongside piped steam inside a dedicated zone, has become the reference case for the region.
For a supplier, the implication is that African projects should be qualified on power quality and continuity before they are qualified on fuel price. A site with a stable 11 kV supply and an LPG boiler is a better prospect than a site with a diesel boiler and a weak feeder, even though the second looks better on paper.
CBAM: the second price on the same kilowatt-hour
Everything above concerns operating cost. CBAM concerns a different ledger — the carbon embedded in a good at the point it enters the EU — and for exporters it functions as an additional, and rising, charge on un-electrified heat.
The arithmetic is straightforward once you accept the boundary. LPG at 88% boiler efficiency emits roughly 0.26 tonnes of CO2 per MWh of delivered heat. At the Q3 2026 certificate price of EUR 82.32, that is about EUR 21.5 per MWh of heat, against a fuel cost near EUR 68 per MWh — so the carbon charge is close to a third of the fuel bill, and it is scheduled to roughly double by 2030 as the free-allocation factor falls from 97.5% to 51.5%. It rises further still if the default-value mark-up moves to 30% because the plant cannot produce verified data.
Certificate cost at EUR 82.32/t = EUR 21.5/MWhth
Fuel cost for the same MWh ≈ EUR 68/MWhth → carbon = +32%
Path A — grid-connected HTHP, COP 3.2, grid 0.66 tCO2/MWh
Embedded emissions after = 0.66 / 3.2 = 0.206 t/MWhth
Avoided = 0.055 t/MWhth → EUR 4.5 avoided
Path B — green-contracted HTHP, 0.05 tCO2/MWh
Embedded emissions after = 0.016 t/MWhth
Avoided = 0.245 t/MWhth → EUR 20.2 avoided
Path B is the whole point. Under CBAM, the carbon value of a high-temperature heat pump is not a property of the machine — it is a property of the power contract attached to it. Grid-connected electrification avoids about a fifth of the heat-related emissions; green-contracted electrification avoids almost all of them, and €20 per MWh of heat is a material sum against a €68 fuel bill. That is the commercial argument for contracting renewable power at the same time as buying the heat pump, and it is the argument a plant exporting to Europe will be forced to have whether or not it wants to.
The paperwork side is where most projects lose money, and the deadlines are now fixed. Certificate sales open on 1 February 2027 for 2026 imports, the first annual declaration is due by 30 September 2027, and from 2028 the penalty for using default values instead of verified actual data reaches 30%. Indonesia’s National Economic Council put the gap at around 90% of compliance cost in its single-case simulation — the difference between a product that lands competitively in Europe and one that does not. For a plant with a steam system, that means fuel metering per boiler, electricity metering per heat pump, and a documented relationship between the two and the functional unit of output. Designed in at commissioning, this is inexpensive. Reconstructed after the fact, it usually fails verification.
What the carbon numbers are actually worth
Here the week’s news is useful precisely because it is deflating. Indonesia’s Article 6.2 agreement, the first in the region with a quantity and a price band, indicates roughly US$20–40 per tonne. Compare that with the CBAM certificate price of EUR 82.32. The two instruments are not interchangeable, and neither is a substitute for an energy saving.
Take the same MWh of heat. Replacing LPG-fired steam with a grid-connected heat pump avoids about 0.055 tonnes of CO2. At US$30 a tonne, that is US$1.65 per MWh of heat — roughly 2% of the fuel bill, and less than the value of a one-point improvement in COP. Contract green power and the avoided emissions rise towards 0.245 tonnes, worth about US$7.35 per MWh. Only then does carbon revenue approach the order of magnitude of the energy saving, and even then it does not lead it.
This is not an argument against carbon finance. It is an argument about sequencing. The energy saving is large, immediate and bankable on the plant’s own balance sheet. The carbon revenue is small, slow, and contingent on verification infrastructure that in most of these markets is still being built — as Vietnam’s pilot exchange demonstrates, with 92 enrolled enterprises and about 1,200 tonnes traded in five months. Underwrite the project on the fuel it displaces. Treat the carbon line as upside, priced at US$20–40, recognised no earlier than 2029 in Vietnam and on a sector-specific timeline in the Philippines.
What buyers, EPCs and suppliers should do before the 2027 compliance year
- Qualify on fuel, not on temperature. Four questions: what is burned, at what price, at what efficiency, and what does the plant actually pay per kWh all-in. If the answer is coal, walk away and say why — it protects the credibility of every other proposal you make.
- Put the threshold in the proposal. State the break-even electricity price at the quoted COP, next to the plant’s actual tariff. A buyer who sees 3.1x headroom understands the investment in one line; a buyer who sees a COP curve does not.
- Price the gas schedule, not just the tariff. In Indonesia and Thailand the case turns on industrial gas prices below US$7–9/MMBtu. Track the regulated gas price as closely as the electricity tariff, because that is where the case opens or closes.
- Model the carbon at US$20–40, not at the CBAM price. Article 6 contracts in the region are landing in the twenties and thirties per tonne. A model that assumes EUR 82 will not survive a lender’s review.
- Meter for CBAM at commissioning. Fuel per boiler, power per heat pump, output per functional unit. The first annual declaration is due 30 September 2027 and the default-value mark-up reaches 30% in 2028.
- Contract the power with the machine. Under CBAM, green-contracted heat is worth roughly four times grid-connected heat per MWh in avoided certificates. Sell the two together or the buyer will discover the gap later.
- In Africa, qualify on continuity. Ask for a year of outage data before quoting. Size thermal storage for resilience, not for tariff arbitrage, and consider the industrial-zone model where power and steam arrive from the same operator.
Frequently asked questions
What electricity price makes an industrial heat pump cheaper than a boiler?
The break-even price is COP × fuel price per kWh ÷ boiler efficiency. Against LPG at US$0.90/kg and an 88% boiler, that is about US$0.256/kWh at COP 3.2. Against natural gas at US$6/MMBtu and an 85% boiler, about US$0.077/kWh. Against diesel at US$0.95/litre, about US$0.359/kWh. Against thermal coal at US$95/tonne, only US$0.059/kWh. That 4.3x spread within one region explains why heat pump payback varies so much between plants on identical tariffs: the machine is rarely the variable, the incumbent fuel is.
Why does an industrial heat pump rarely beat a coal boiler in Asia?
Because the arithmetic demands a coefficient of performance no commercial machine delivers. At a US$0.082/kWh industrial tariff in Vietnam and coal at US$95/tonne burned at 80% efficiency, the required COP is about 4.4; in South Africa, with domestic coal near US$70/tonne and power around US$0.12/kWh, it exceeds 6. Typical HTHP performance at 120–165 °C is 2.5–3.8. The addressable market is therefore the LPG, diesel and heavy fuel oil boiler fleet, plus electric resistance heating and purchased steam — not the coal fleet.
What does COP31’s 35-by-35 commitment actually require?
Launched by the Turkish presidency on 10 November 2026 in Antalya, it targets lifting electricity’s share of global final energy from roughly 20–23% to 35% by 2035 through electrification of transport, buildings and industry. Australia, Ethiopia, Germany and Norway endorsed it at launch, the EU co-hosted a first Electrification Forum, and the IEA will run the tracking mechanism. Climate Action Tracker estimates current policies reach only 28%. It is voluntary and its place in the final cover decision remains contested, so treat it as a directional signal for grid and finance policy rather than a binding obligation.
How does CBAM change the business case for process heat electrification?
It puts a certificate price on the CO2 embedded in exported goods, including heat raised inside the installation boundary. The Q3 2026 reference price was EUR 82.32/t. LPG-fired steam at 88% efficiency emits about 0.26 tCO2 per MWh of heat, or roughly EUR 21.5/MWh against a fuel cost near EUR 68 — close to a third of the fuel bill, and set to roughly double by 2030 as the free-allocation factor falls from 97.5% to 51.5%. Certificate sales open 1 February 2027 and the first annual declaration is due 30 September 2027.
Is missing CBAM data more expensive than buying certificates?
Yes. Where verified actual data is absent the EU applies default values with a mark-up of 10% in 2026, 20% in 2027 and 30% from 2028. Indonesia’s National Economic Council reported that verified national data could cut compliance cost by around 90% versus EU defaults in a single-case simulation, and Malaysia’s government costed 2026 iron and steel exposure at about MYR 970.7 million (US$237 million). For a heat project, fuel and power metering designed at commissioning is a trade asset, not a reporting chore.
What is a carbon credit worth per MWh of electrified process heat?
Less than most sellers assume. Replacing LPG-fired steam avoids about 0.26 tCO2/MWh, but a grid-connected HTHP at COP 3.2 on a 0.66 tCO2/MWh grid avoids only about 0.055 t/MWh, because the electricity carries its own emissions. At US$30/t — inside the band indicated by Indonesia’s first Article 6.2 agreement — that is about US$1.65/MWh, roughly 2% of the fuel bill. With green-contracted power the avoided emissions approach 0.245 t/MWh, worth about US$7.35/MWh.
Conclusion: the target is global, the threshold is local
A 35% electrification target for 2035 is a useful thing for the world to have written down. It gives ministries a number to plan grid investment against, it gives development banks a category to lend into, and it gives the IEA a metric to publish every year. None of that will make a single steam plant in Dong Nai, Karawang or Naivasha switch.
What switches a plant is the ratio between the price of a kilowatt-hour and the price of the fuel it is trying to stop burning, weighted by the efficiency of the boiler and the coefficient of performance of the machine. That ratio ranges across this region from US$0.053 per kWh against South African coal to US$0.359 against Nigerian diesel — a factor of nearly seven, on the same basic technology. A supplier who quotes a COP without stating the threshold is answering a question the buyer has not asked; a buyer who asks for payback without disclosing the fuel price is asking for a number that cannot be produced.
Onto that ratio, this week added two further prices. CBAM now charges EUR 82.32 a tonne for the carbon in exported goods, including the carbon in their steam, and the charge roughly doubles by 2030 while the penalty for unverified data rises to 30%. Article 6 contracts, meanwhile, are clearing in the twenties and thirties of dollars a tonne — an order of magnitude below the CBAM penalty and, at 2% of a fuel bill, not a reason to invest on its own.
Read together, the three numbers give a clean hierarchy of motive. Electrify because the fuel is expensive, which is true today in every LPG, diesel and purchased-steam plant in the region. Electrify because CBAM charges for the carbon and because green-contracted power removes almost all of it, which is true for anyone exporting to Europe. And treat the carbon credit as a modest, late-arriving bonus, priced honestly at US$20–40 and recognised no earlier than 2029 in most of these markets.
That is what the electrification threshold means in practice. The target is global. The threshold is local, it is arithmetic, and it is the only number that has ever closed a purchase order.